

Generating 1 Billion Rows of Complex Synthetic Data 🚀
Friendly guide to generating 1 billion rows of complex synthetic data with `dbldatagen`.

Recently, my coworker introduced me to a library for generating synthetic data - `dbldatagen`.
The
dbldatagenDatabricks Labs project is a Python library for generating synthetic data within the Databricks environment using Spark. The generated data may be used for testing, benchmarking, demos, and many other uses.It operates by defining a data generation specification in code that controls how the synthetic data is generated. The specification may incorporate the use of existing schemas or create data in an ad-hoc fashion.
It has no dependencies on any libraries that are not already installed in the Databricks runtime, and you can use it from Scala, R or other languages by defining a view over the generated data.
Credit: Databricks Labs
I decided to test it and build 1 billion rows of complex synthetic data complete with user transactions, timestamps, nested structures, or even logically dependent data.
But first, why do we even bother? What are some of the use cases of Synthetic Data?
Testing and Development - We can simulate large-scale data to test our systems without compromising real data.
Performance Benchmarking - We can assess how applications handle big data loads.
Data Privacy - We can use realistic data without exposing sensitive information.
Setting Up the Environment
Ok, now, let’s jump in and write code that generates our transactions dataset.
First of all, we need to install all the dependencies. In my case, I was testing the code in Google Colab, so I had to install dbldatagen and jmespath.
dbldatagen - Library that helps us generate synthetic data.
jmespath - Helps with JSON queries, which can be useful for data manipulation. I got an error without
jmespathwhen I tried to importdbldatagen.You might also need to install
pyspark.
pip install dbldatagen
pip install jmespath
pip install pyspark
Importing the Necessary Libraries
Now, let’s import everything we’ll need:
import dbldatagen as dg
from pyspark.sql import functions as F
from pyspark.sql.types import (
    IntegerType, FloatType, StringType, TimestampType,
    StructField, BooleanType, StructType, ArrayType, DecimalType
)
Defining the Data Specifications
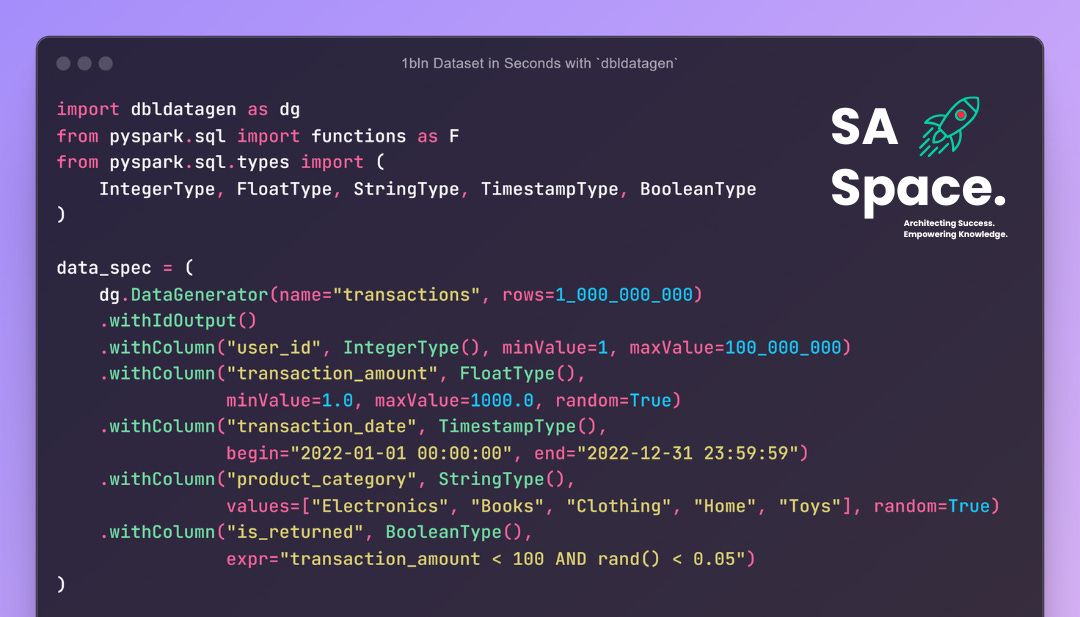
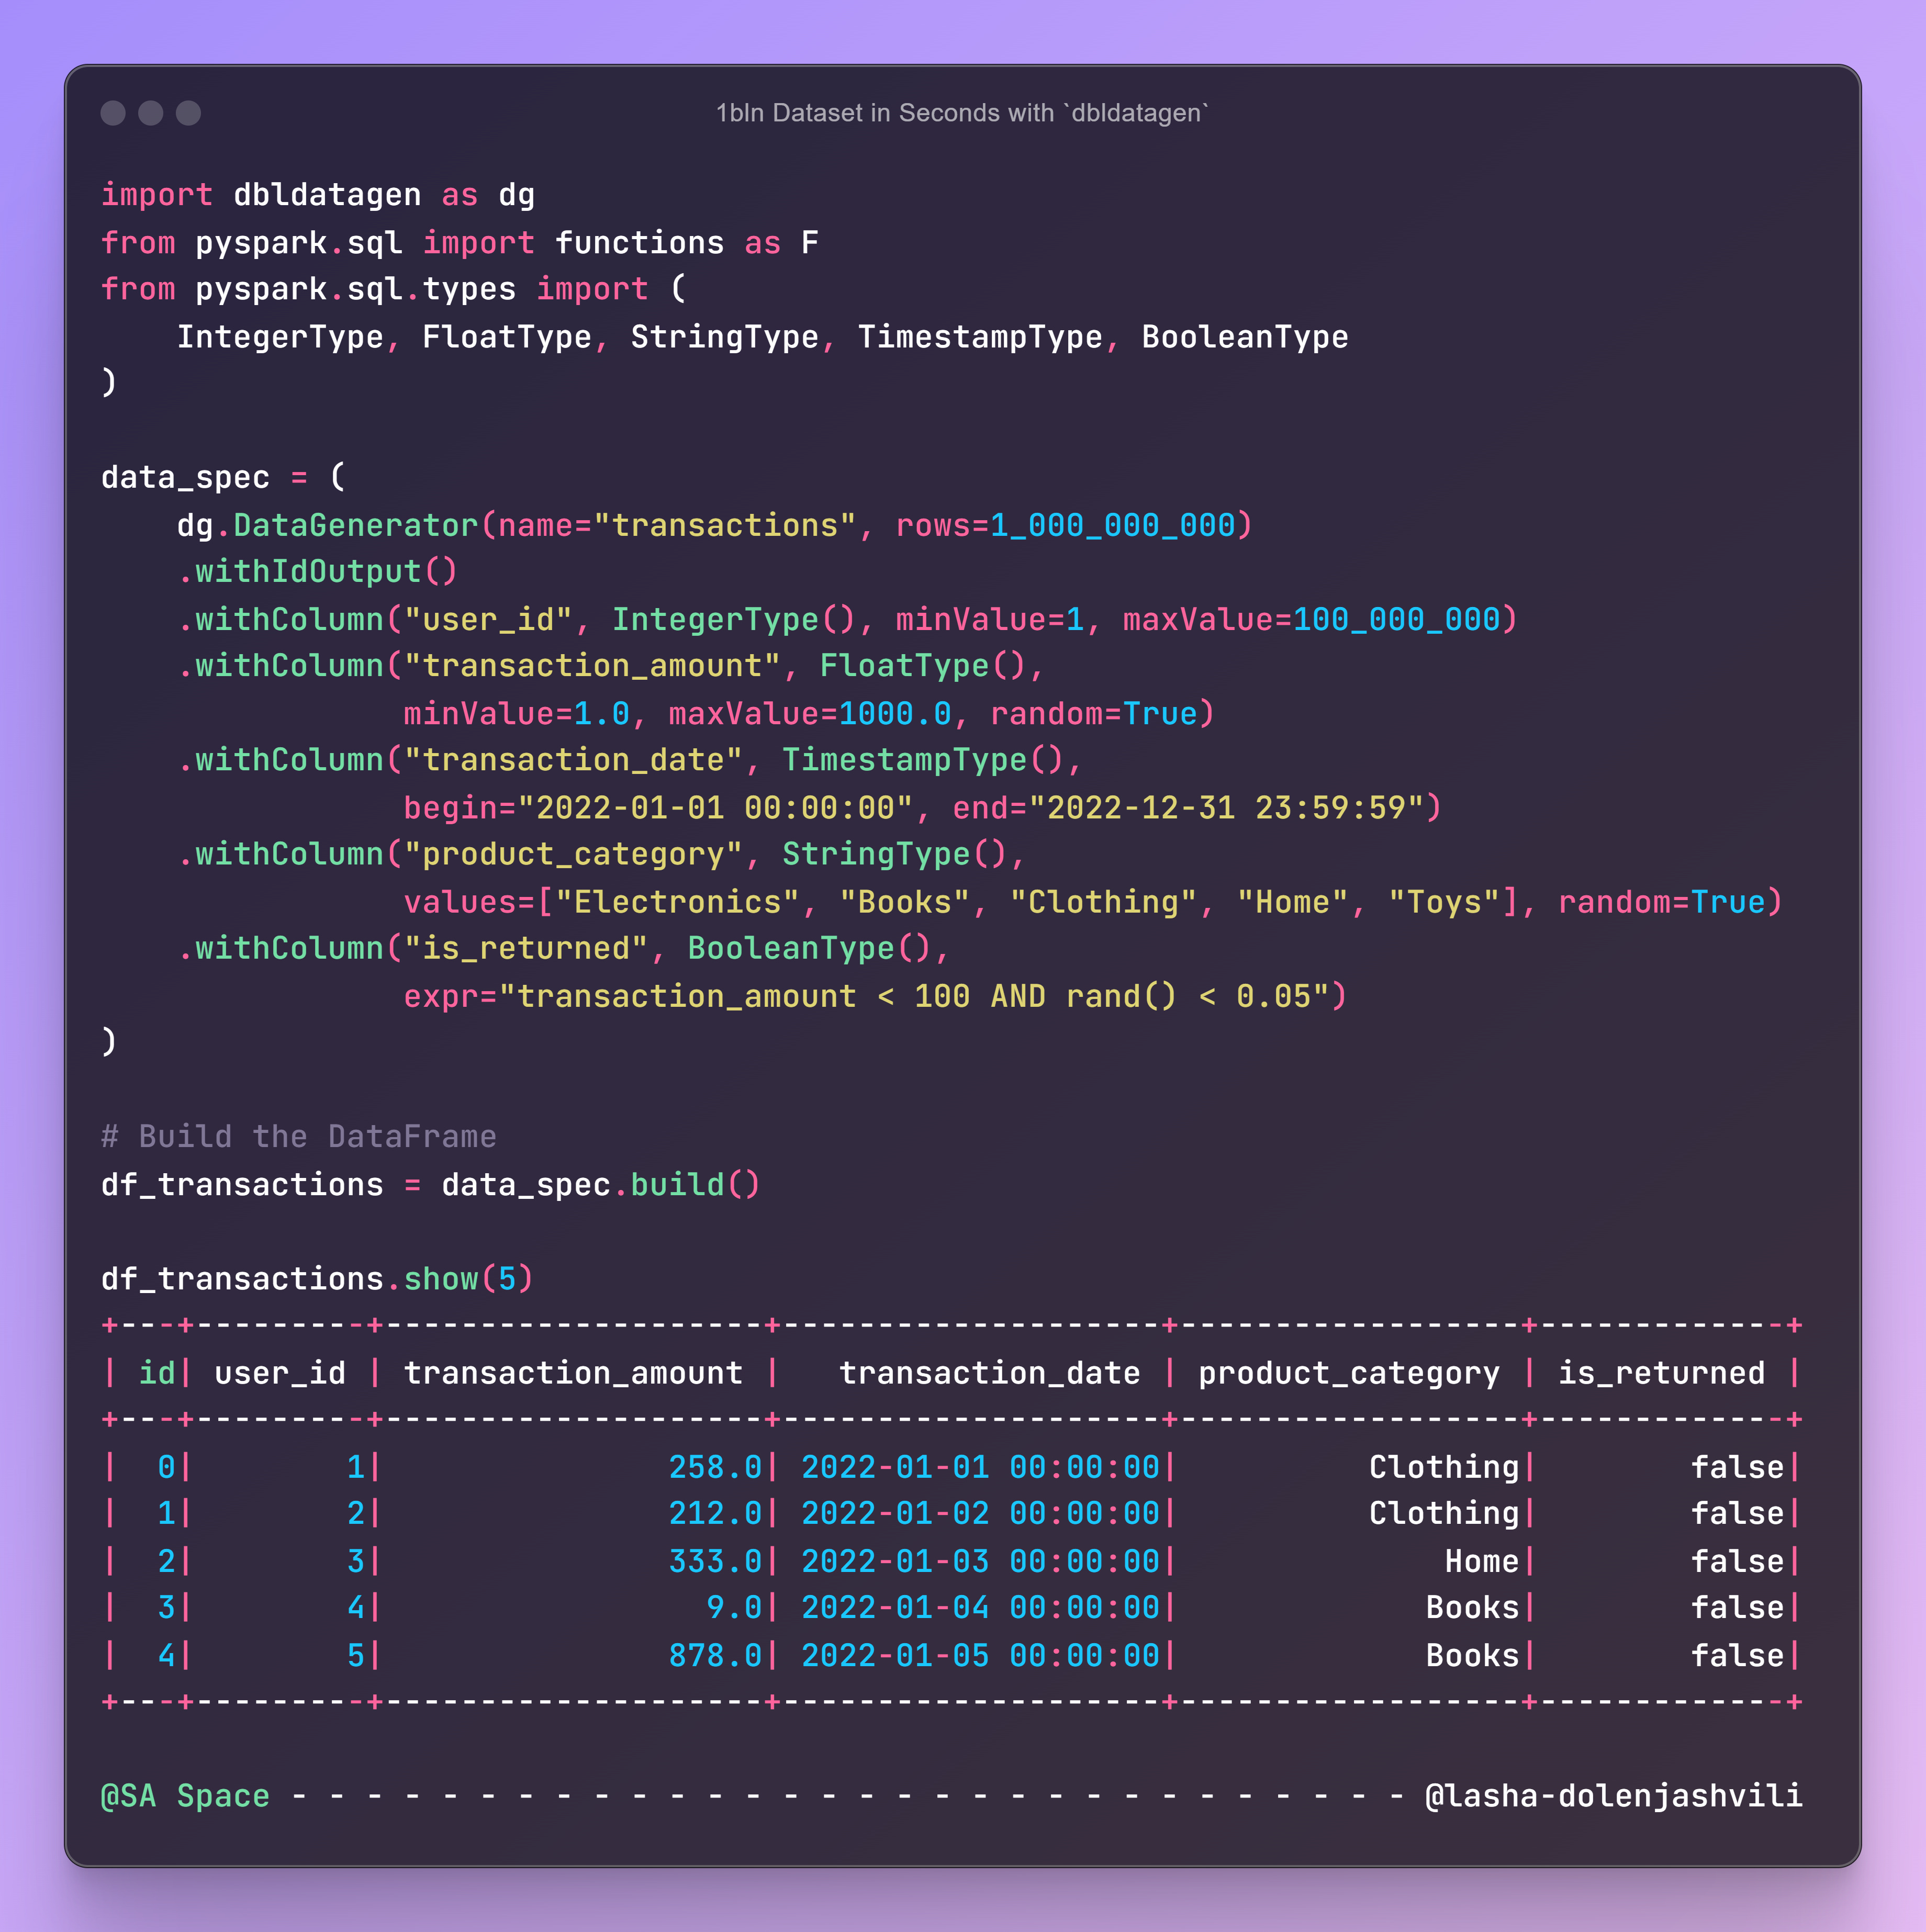
Next, we need to define a data generator that creates a complex dataset with various data types and structures.
# Number of rows to generate (1 billion)
row_count = 1_000_000_000

data_spec = (
    dg.DataGenerator(name="transactions", rows=row_count)
    .withIdOutput()
    .withColumn("user_id", IntegerType(), minValue=1, maxValue=100_000_000)
    .withColumn("transaction_amount", FloatType(), minValue=1.0, maxValue=5000.0, random=True)
    .withColumn("transaction_date", TimestampType(), begin="2022-01-01 00:00:00", end="2022-12-31 23:59:59")
    .withColumn("product_category", StringType(), values=["Electronics", "Books", "Clothing", "Home", "Toys", "Sports", "Automotive"], random=True)
    # Add a Boolean column
    .withColumn("is_returned", BooleanType(), expr="transaction_amount < 100 AND rand() < 0.05")
    # Add an Array column
    .withColumn("tags", ArrayType(StringType()), expr="array(product_category, substr(transaction_date, 0, 10))")
    # Add a Struct column
    .withColumn("shipping_address", StructType([
        StructField("street", StringType(), True),
        StructField("city", StringType(), True),
        StructField("state", StringType(), True),
        StructField("zip", StringType(), True)
    ]), expr="""
        named_struct(
            'street', concat(cast(rand() * 9999 as INT), ' Main St'),
            'city', element_at(array('New York', 'Los Angeles', 'Chicago', 'Houston', 'Phoenix'), cast(rand() * 5 + 1 as INT)),
            'state', element_at(array('NY', 'CA', 'IL', 'TX', 'AZ'), cast(rand() * 5 + 1 as INT)),
            'zip', concat(cast(rand() * 89999 + 10000 as INT))
        )
    """)
    # Add a Decimal column
    .withColumn("tax", DecimalType(5, 2), expr="transaction_amount * 0.08")
    # Add a Date column
    .withColumn("delivery_date", TimestampType(), expr="date_add(transaction_date, cast(rand() * 7 as INT))")
    # Add a Column with Skewed Data
    .withColumn("payment_method", StringType(), values=["Credit Card"] * 80 + ["PayPal"] * 15 + ["Bitcoin"] * 5, random=True)
    # Introduce Null Values
    .withColumn("coupon_code", StringType(), expr="CASE WHEN rand() < 0.2 THEN concat('SAVE', cast(rand() * 100 as INT)) ELSE NULL END")
    # Add a Column with Dependent Values
    .withColumn("loyalty_points", IntegerType(), expr="CASE WHEN user_id % 2 = 0 THEN cast(transaction_amount / 10 as INT) ELSE 0 END")
    # Add a Nested Array of Structs
    .withColumn("items", ArrayType(StructType([
        StructField("item_id", IntegerType(), True),
        StructField("quantity", IntegerType(), True),
        StructField("price", FloatType(), True)
    ])), expr="""
        array(
            named_struct('item_id', cast(rand() * 1000 as INT), 'quantity', cast(rand() * 5 + 1 as INT), 'price', rand() * 100),
            named_struct('item_id', cast(rand() * 1000 as INT), 'quantity', cast(rand() * 5 + 1 as INT), 'price', rand() * 100)
        )
    """)
    # Add a Geospatial Data Column
    .withColumn("location", StringType(), expr="concat(cast(rand() * 180 - 90 as STRING), ', ', cast(rand() * 360 - 180 as STRING))")
)
Let me walk you through each part to understand what’s happening.
Basic Columns
user_id: Random integers between 1 and 100,000,000 representing unique users.transaction_amount: Random floats between $1.00 and $5,000.00, simulating purchase amounts.transaction_date: Random timestamps throughout the year 2022.product_category: Randomly selected from a list of categories like Electronics, Books, etc.
Advanced Columns
is_returned: A boolean indicating if the item was returned. There's a 5% chance for items under $100.tags: An array containing the product category and transaction date, useful for search indexing.shipping_address: A struct containing nested fields like street, city, state, and zip code.tax: Calculated as 8% of the transaction amount, stored as a decimal.delivery_date: A date representing when the product is expected to be delivered, up to 7 days after purchase.payment_method: Skewed data where 80% use Credit Card, 15% use PayPal, and 5% use Bitcoin.coupon_code: 20% chance of having a coupon code; otherwise, it's null.loyalty_points: Dependent onuser_id; even-numbered users earn points based on the transaction amount.items: A nested array of structs, each representing items in the transaction withitem_id,quantity, andprice.location: Geospatial data combining latitude and longitude coordinates.
You can copy my Google Colab Notebook to try the
dbldatagenyourself.
🚀 To support my newsletter, follow the Paypalme Link.
Generating the Data
We have defined our data specifications, now we need to generate the actual DataFrame.
# Build the DataFrame
df = data_spec.build()

# Explore the Generated Data
df.show(5)Note: Generating such a large dataset requires significant computational resources. If you're running this on a personal machine, consider reducing
row_countto a manageable number, like1_000_000.
Here’s what the sample output looks like for a smaller number of columns.
You can copy my Google Colab Notebook to try the
dbldatagenyourself.
I’m impressed. I tried Faker several weeks ago to generate synthetic data and it’s not even close to dbldatagen’s performance and functionalities.
For more information, check out their Official Github Repository.
What do you think? Have you ever used synthetic data in your projects? How did you generate it?
Enjoyed the article? If you have questions or need further clarification, leave a comment below or reach out directly.
✅ Thank you for reading my article! I welcome any questions, comments, or suggestions you may have.
💨 Keep Knowledge Flowing by following me for more content on Solutions Architecture, System Design, Data Engineering, Business Analysis, and more. Your engagement is appreciated.
🚀 To support my newsletter, follow the Paypalme Link.
🔔 You can also follow my work on:
You can also check out My Resume